When you become a seller, you can go to your Seller Dashboard to view stats and insights.
Dashboard page includes a bunch of graphs and data to show you total buyers, the number of orders that you received today and total orders, today revenue and total revenue, how many products that you sell, and much more.
This guide explains how to read and understand your store’s stats and insights.
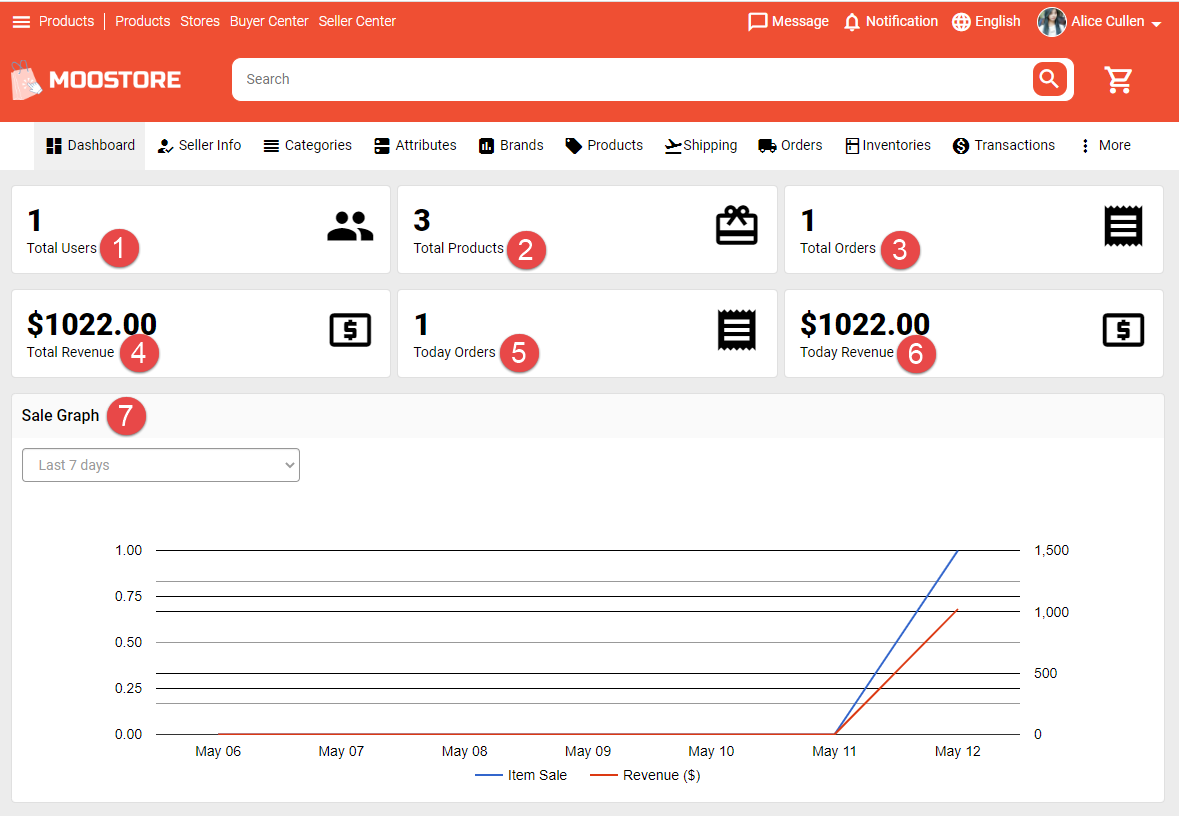
1. Total users: This section of stats counts the number of users buy product in your store.
2. Total products: This section of stats counts the number of products of your store.
3. Total orders: This section of stats shows the total orders that you receive.
4. Total revenue: This section of stats shows the total revenue.
5. Today orders: This section of stats shows the number of orders that you receive today.
6. Today revenue: This section of stats shows your today revenue.
7. Sale graph: There are two main units of sale measurement are Item Sale and Revenue.
– An item sale is counted when an order is fulfilled successfully.
– Revenue is calculated from completed orders.
In the graph, the horizontal axis depict a continuous progression by time, and the vertical axis reports value for a metric. When you click on the line, it will show the stats value.
You can filter to view graph by Last 7 days, this month, last month, last 3 months, last 6 months and this year.